It’s hard to believe that it has been 6 years since this happened:
![]()
July 2022 was the 5-year anniversary of the opening of the Permian Basin's first local sand plant.
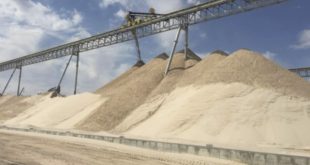
While some other basins had a smattering of small and obscure local sand mines prior to the Permian sand boom (i.e. Haynesville, Eagle Ford and even the MidCon), the Permian dune sand rush was what brought local sand to the forefront as a key trend. And it catalyzed a massive buildout of local sand across the Lower 48.
Over the next five years since that first Permian dune sand mine was built by Hi-Crush in the Permian, more than 65 in-basin sand plants would be built.
Today, local sand has captured dominant market share in the Permian, Eagle Ford, Haynesville, and MidCon, and it is a smaller (but still important) part of the supply stack in the Bakken/Rockies and even the Marcellus.
Here's a look at some age stats for plants in key basins.
| Oldest Plant In-Basin (years old) | Nameplate-Weighted Average Age Of Local Sand Supply Base (years old) | Heaviest New Plant Opening Year (MMTPA) | % Of Nameplate Constructed Since 2021 | |
| Permian | 5.4 | 4.0 | 2018 | 9% |
| Eagle Ford | 11.5 | 4.4 | 2019 | 4% |
| Haynesville | 7.5 | 3.3 | 2022 | 32% |
| MidCon* | 5.8 | 4.4 | 2018 | 0% |
| Marcellus | 0.9 | 0.9 | 2022 | 100% |
| Bakken/Rockies | 3.3 | 2.5 | 2021 | 44% |
*Excludes Legacy Mill Creek / Roff plants
Source: www.lium.com/shale-services (mine databases)
With the local sand supply base maturing, plants have undergone some major maintenance cycles this year. There have also been some reports of quarry issues at several facilities, as mining has matured, however we don't see any concern on the near-term horizon about reserve exhaustion. Most of these plants were built on deposits they can mine for more than 15 years at full throughput, however operating costs could creep slowly higher as the easiest / closest deposits are tapped first.
 Infill Thinking Lifting the O&G knowledge curve


