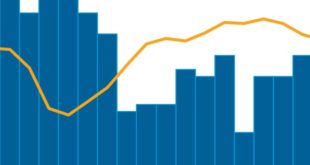
Going through local sand mine operating data for 3Q20 this week, a notable bifurcation stands out. Specifically… There’s a lot more to this story… Login to see the full update… To read this update and receive our research newsletters, you must be a member. If you are new to Infill …
Read More »How Does In-Basin Sand Supply Distribution Line Up With Completions At The Bottom? [Chart Of The Day]
With US onshore activity limping up from the bottom of a harsh downturn, we asked the question – how well did the frac sand industry do in matching supply to demand regionally? We all know that sand producers…. There’s a lot more to this story… Login to see the full …
Read More »The One Chart That Says It All About US Frac Sand Supply/Demand
What a wild crazy insane ride the past five years have been in frac sand. This chart pretty much sums it up folks (click the chart to see it full size in a new window). Chart is followed by a couple observations… There’s a lot more to this story… Login …
Read More »The Bankrupting Of Oilfield Service [Chart Of The Day]
Unsurprisingly, lawyers and restructuring advisors are the biggest winners in this mess. They are making out like bandits and harvesting a massive payday from the industry’s financial predicament. There’s a lot more to this story… Login to see the full update… To read this update and receive our research newsletters, …
Read More »A Cashless 2H20 Oilfield Bounce? [Charts Of The Day]
Lots of analysts, ourselves included, are writing about the uptick in completions and frac crew count. But let’s be careful not to put the cart before the horse… There’s a lot more to this story… Login to see the full update… To read this update and receive our research newsletters, …
Read More »The Most Important Thing To Watch This E&P Earnings Season If You Are An OFS Provider [Chart Of The Day]
With E&P earnings heating over the next 7-10 business days, one critical thing we’ll be watching closely is how…. There’s a lot more to this story… Login to see the full update… To read this update and receive our research newsletters, you must be a member. If you are new …
Read More »The Rise & Fall Of In-Basin Sand Supply [Chart Of The Day]
Lower 48 local sand capacity peaked in 4Q19. Here’s what’s happened to this supply stack since then… There’s a lot more to this story… Login to see the full update… To read this update and receive our research newsletters, you must be a member. If you are new to Infill …
Read More »A Boost At The Bottom – PPP Money Flowed Mightily Into The Frac Supply Chain As Crews Fell [Chart Of The Day]
Clearly, based on the following table, the PPP loan program provided a material source of capital for many smaller firms in the US oilfield at the cyclical bottom, specifically those in the often ignored frac supply chain. Good! We are happy to see that employees in this critical segment of …
Read More »This Oil Price Drop Has Triggered A Nearly Simultaneous Restructuring Response
With oilfield bankruptcy and restructuring news heating up into 2H20, the industry has fallen into low-cycle restructuring mode much more expediently than in prior cycles. We take a look at some interesting correleations and discuss what it might mean going forward in this chart of the day update… There’s a …
Read More »Flat As A Pancake… [Chart Of The Day]
A wellness check this week on on the key economic engines of the oilfield industry reveals some interesting trends… There’s a lot more to this story… Login to see the full update… To read this update and receive our research newsletters, you must be a member. If you are new …
Read More »
Infill Thinking Lifting the O&G knowledge curve