 Infill Thinking Lifting the O&G knowledge curve

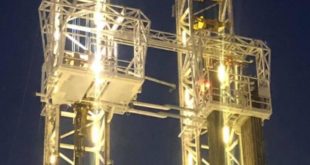
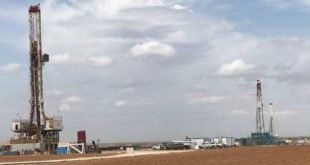
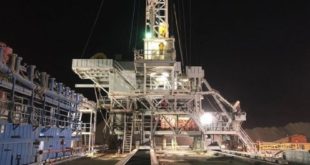
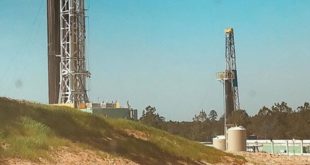
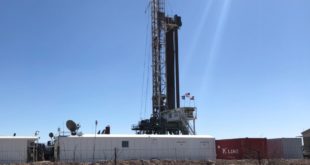
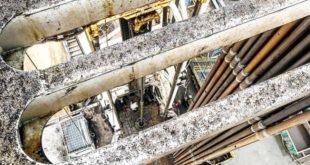
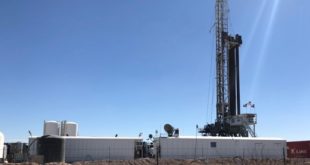
During the past week or so, pictures have surfaced on social media showing a US onshore industry first in land drilling: simultaneous drilling accomplished by joining together two land rigs. We talked with management to learn more and discuss the implications in this update. There’s a lot more to this …
Read More »Piggy Back Land Rigs Spotted In The Eagle Ford Behaving Like Drillships [Pictures & Drilling Company Confirmation]